
More Information
Submitted: November 30, 2022 | Approved: December 27, 2022 | Published: December 28, 2022
How to cite this article: Al Balushi NAM, Al Rashdi SSA, Nageswara Rao L, Almarhoon F. Produce starch-based bioplastic from different renewable biomass sources. Ann Clin Hypertens. 2022; 6: 020-024.
DOI: 10.29328/journal.ach.1001032
Copyright License: © 2022 Al Balushi NAM, et al. This is an open access article distributed under the Creative Commons Attribution License, which permits unrestricted use, distribution, and reproduction in any medium, provided the original work is properly cited.
Keywords: Bioplastic; Starch and natural sources; Biodegradability test; Moisture content

Produce starch-based bioplastic from different renewable biomass sources
Noura Ali Moosa Al Balushi, Shabib Sulaiman Ali Al Rashdi*, Nageswara Rao Lakkimsetty and Fatema Almarhoon
College of Engineering, National University of Science and Technology, Sultanate of Oman
*Address for Correspondence: College of Engineering, National University of Science and Technology, Sultanate of Oman, Email: [email protected]
Due to the adverse environmental impacts of synthetic plastics, biodegradable plastics development for both industrial and commercial applications is essential for the present scenario. In addition to the non-degradability of petroleum-based plastic and its impacts, so it is very important to find an alternative to petroleum-based plastic. Starch-based bioplastics are an excessive substitute for petroleum-based plastics due to their significant properties compared with natural sources. This research aims to formalize five new formulas of bioplastic by combining two sources of starch, extracted from various biomass sources, its properties and comparison between them. The moisture content shows 2.07% and 0.984% for samples F and B respectively and that indicates that the samples which contain a high amount of corn starch have less moisture content. The highest results of biodegradation percentages were 68.27% and 52.6% which are for samples A and D respectively, and the lowest biodegradation percentage were 34.33% and 31.29% which are for samples F and B respectively.
Plastic is a vital asset in each and every aspect of modern life. It offers various benefits owing to its lightweight, flexible size and cheaper cost, which makes it the appropriate choice in almost all the applications of domestic and industries but the excessive and impolitic use of plastic consequences the corruption of the environment and affects human and animal health. In order to solve this problem, there is a need to find an alternative way for producing harmless Plastic and one of the proper ways is to produce Bioplastic which is a Plastic that can decompose by the action of microorganisms for instance by microorganisms [1]. The benefit of using Bioplastic is its capability to undergo decomposition in a short period of time without any side effects on the environment. It is eco-friendly plastic and made from inexpensive raw materials. Additionally, the manufacturing cost of Bioplastic is less compared to Petroleum-Based Plastic [2]. Genuine Bio-based Plastic materials were developed at the beginning of the 90s, highlighting that the biodegradation property would be an effective addition to short-term applications like packaging where, it appears that long-lasting and durable plastics are not always suitable for this type of application besides, reducing the environmental impacts of using Petroleum-based plastic [3]. Starch is an interesting alternative to Petroleum-based plastic by considering starch is a form of Glucose-based polymer in addition, to being abundant, biodegradable and cheap [3]. Starch can easily decompose by microorganisms in soil without polluting the ecosystem. These properties led starch to be the second major raw material that can be used in plastic industries for the production of Bioplastic. Currently Bio plastic shows the main implementation in packaging materials, however, in the future, it may use in different fields also such as pipe fittings, insulation material construction material, insulation material, etc.., [2,4].
Bioplastic advantages
Eco Friendly: Petroleum-based plastic depends on fossil fuels which is a non-renewable source where acquiring fossil fuels does a lot of damage to the environment and the use of it in Plastics industries increases the greenhouse gases in the atmosphere which obstructs the world’s attempts to reduce CO2 emissions. On the other hand, Bioplastics are made from biomasses like vegetables and trees even waste which are completely biodegradable and their manufacturing process is not harmful as the previous one. Besides, during the engineering of Petroleum-based plastics numerous pollutions follow for example, during the fabrication of PVC plants can release dioxins, known as carcinogens which bio-accumulate in humans as well as in wildlife and they linked with immune and reproductive system illnesses [5].
Require less time to degrade: Petroleum-based plastic takes about thousands of years to degrade and break down these Plastics remain in the environment and most obviously on the ocean beds where they do extreme damage for years [6]. These Plastics delay growth and destroy the natural environment. Bio-plastics conversely, involve noticeably less time to degrade where which reduces the huge pressure on our landfills [5].
Toxicity: Some of the plastics destroy rapidly in the oceans liberating very harmful chemicals into the water thus, harming plants, animals, and humans by entering the food chain. These chemicals such as heavy metals, pesticides, Polycyclic Aromatic Hydrocarbons (PAHs), Bisphenol A (BPA), and Polychlorinated Biphenyls (PCBs), which can disrupt important physiological processes of animals producing for example diseases and problems in reproduction. Bioplastics are totally safe and do not have any of those chemicals or pollutants where Bio plastic inoffensively breaks down and is absorbed directly into the soil [5,7].
Problem description and identification
Since 2018 year, 380 million tons of Plastic produced in the world each year and that’s virtually equivalent to the weight of the whole human population. In all, half of all Plastic produced is intended to be used only one time and then thrown away.
Plastic waste is now so widespread in the natural environment which makes scientists have even suggested that it could serve as a biological indicator of the anthropogenic era. By 2050, if the current trends continue; our oceans may contain more and more Plastic than fish thus, by considering the interminable scenario it has become essential for us to look for other methods to produce products that can be as flexibly used as Petroleum-based plastic is. Besides, this need was properly recognized by many researchers in the earlier years who have tried to come up with several eco-friendly, biodegradable and economic options that can replace Plastic [6] (Figure 1).
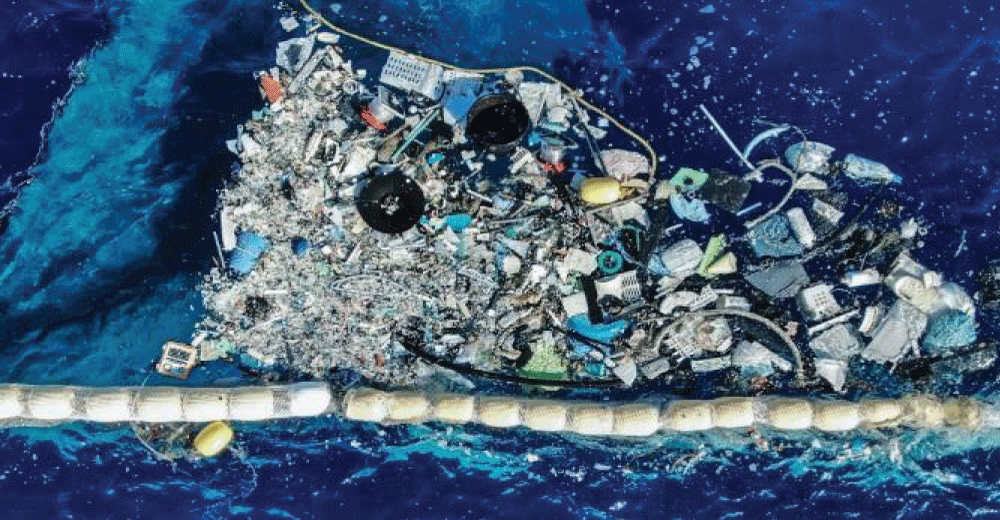
Figure 1: Marine Plastic Waste [9].
Likewise, there is a need to find new sources for producing some consumption Plastic applications with low cost due to the high manufacturing cost of Petroleum-based plastic and because of the high cost of petrol itself as well as, to reduce the CO2 emissions which are produced at its manufacturing industries then, as a consequence of that reducing the use of Petroleum-based plastic will reduce the consumption of petroleum where, increasing demand for global plastic consumption every year leads to reduce the amount of petroleum because it considered as a non-renewable source hence, use bioplastic, especially for human consumed items like plastic bags, drink bottles, plastic cups and packaging applications will reduce the consumption of petroleum in the world along with reducing the negative impact of Petroleum-based plastic to the user and environment.
In that regard, the target of this project is to produce new flexible formula of Bioplastic having properties near the petroleum-based plastic properties with short degradation time, harmless to the environment, cheapest, better for short-term plastic applications and from renewable biomass sources by combining two sources of starch together.
Experimental setup and methodology
Chemicals and materials: Potatoes peels (Used as a starch source), Corn, Glycerin (Propan-1, 2, 3 triol) (C3H8O3), and Acetic acid (CH3COOH)
Flow Chart of the Process:
Experiment procedure and methodology
After collecting the required chemicals, materials, equipment and tools the following phases go for producing Bioplastic. Figure 2 shows the production of bioplastic with various compositions of samples.
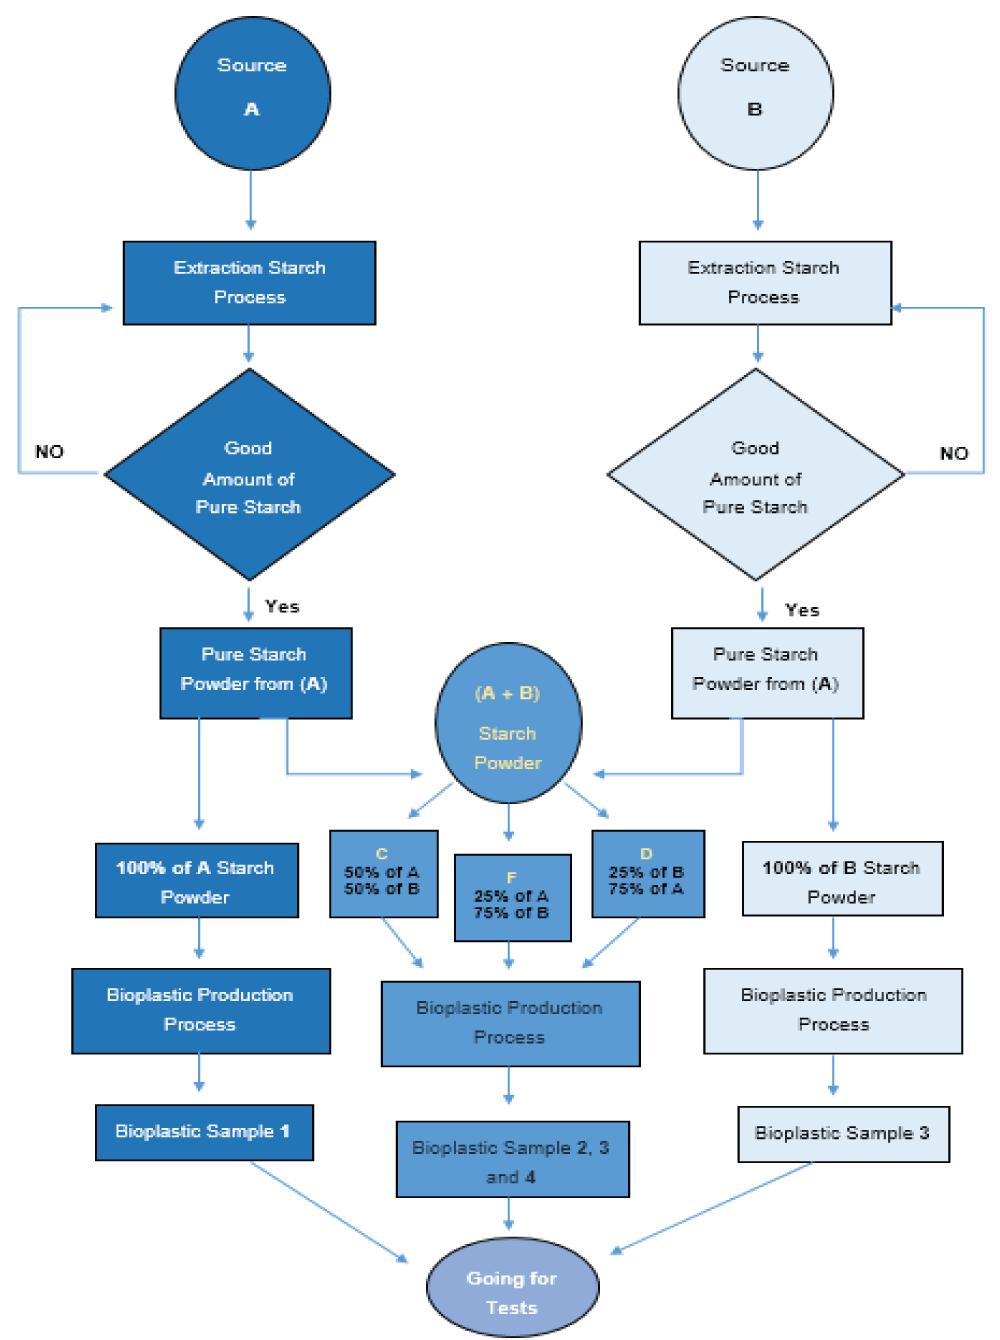
Figure 2: Bioplastic production process Flowchart. A = Potato Starch; B = Corn Starch
Phase 1: Extraction of starch from biomass sources
The sources of starch are grated by a grater or blended with water with the help of a Grinder and then, the potato solution drives to the filtration operation and settled were where the process repeated until getting pure white starch without any impurities as possible as much (Figure 3).
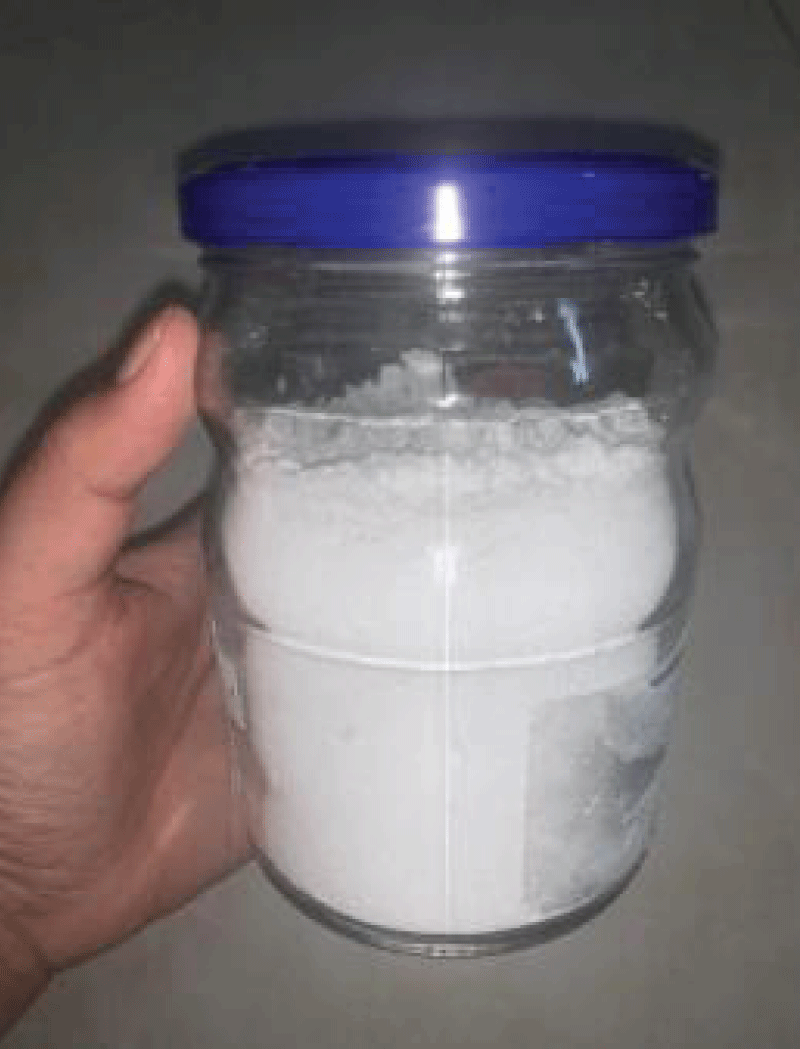
Figure 3: Extracted pure white starch saved in a closed container after drying.
Phase 2: Bioplastic production process
After extracting the powder starch from the two defined sources; five samples A, B, C, D and F were taken to produce five formulas of bioplastics then, a certain amount of glycerol/ plasticizer, Acetic acid/ acid and water/solvent adding to the samples; 5 ml, 5 ml, 60 ml, and 10 g respectively. It was mixed at a high temperature of about 80 °C at an Electric stove with the aid of a stirrer rod/ spoon until forming a thicker mixture. The prepared mixtures were poured into five pieces of Aluminium foil at the same size and spread uniformly. Then, they were kept for 2 days at room temperature for drying, after drying five films of bioplastics from five different samples were identified. The properties were studied in the next phases of the research by conducting moisture content and biodegradability test. The following proportions were studied with potato and corn (Table 1).
| Table 1: Sample composition. | |
| Sample | Composition |
| A | 100% Potato means 10 g of Potato starch |
| B | 100% Corn means 10 g of Corn starch |
| C | 50% Corn + 50% Potato means 5 g of Corn starch + 5 g of potato starch |
| D | 25% Corn + 75% Potato means 2.5 g of Corn starch + 7.5 g of potato starch |
| E | 75% Corn + 25% Potato means 7.5 g of Corn starch + 2.5 g of potato starch |
Phase 3: Moisture content test
Bioplastics were weighed and heated in an oven at 100 °C with different intervals of times 20 min, 30 min, and 40 hrs until the weight become constant, moisture content was calculated by using the following equation:
Where, W1 = weight of sample before heating (g); W2 = weight of sample after heating (g) (Figure 4).
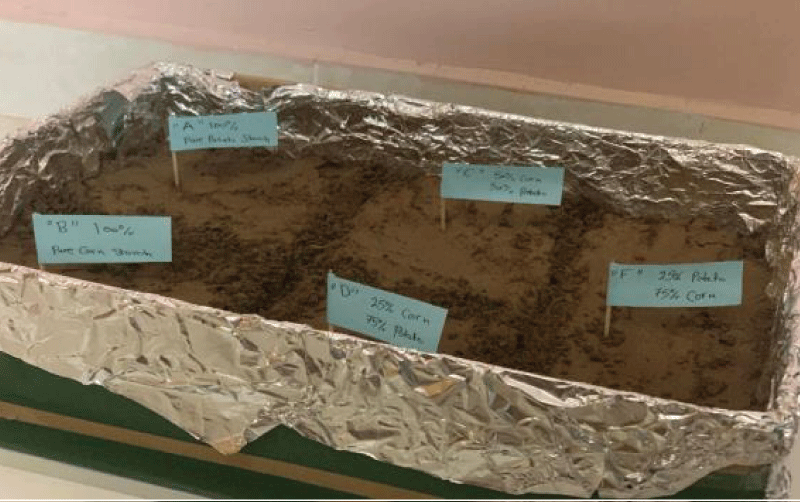
Figure 4: Samples were buried into wet soil boxes and flags with their names were used to sign them and to know each sample.
Phase 4: Degradation test
Bioplastic was cut into 5 cm x 5 cm size pieces. Initial weight was noted after the samples were buried into a depth of 10 cm in 50 g of wet soil ensuring the availability of the biodegradation conditions such as microorganisms, humidity, sunlight, and oxygen. Bioplastic samples were weighed after burying weekly basis. The biodegradation percentage (weight loss) is calculated by using the following equation:
Where W2 and W3 are the initial and final weight/ mass of samples respectively (g)
Analysis of the five bioplastic samples properties
The results show that the samples which have more potatoes starch were very soft and transparency but their durability and flexibility were low, on the other hand, samples which have more corn starch were rough and their transparency was very low but their durability and flexibility were high for example, sample A which is 100% from potatoes starch was very soft and transparent but their durability and flexibility were low. Sample B which is 100% from corn starch was very rough and its transparency was low but its durability and flexibility were very high. Therefore, produced bioplastics from potatoes starch or which have a high amount of potatoes starch have been more soft and transparent but their durability and flexibility have been low, and the produced bioplastics from corn starch or which have a high amount of corn starch have been not as much of soft and transparent but their durability and flexibility have been high (Figure 5) (Table 2).
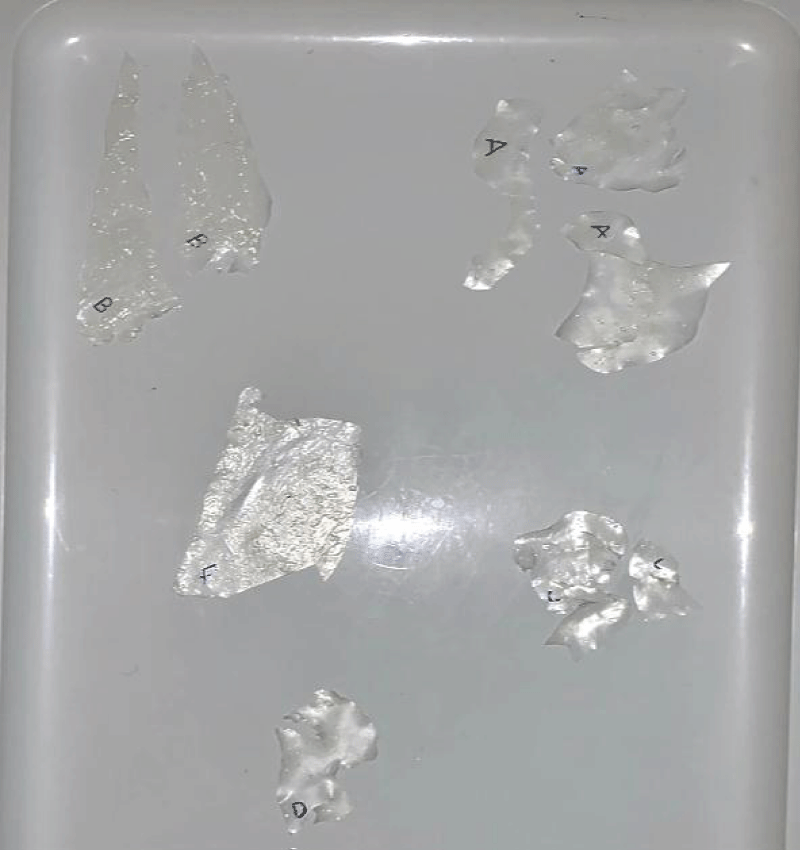
Figure 5: Samples were buried into wet soil boxes and flags with their names were used to sign them and to know each sample.
| Table 2: Bioplastic samples properties. | ||||
| Sample | Transparency | Texture | Durability | Flexibility |
| A | Very High | Very Soft | Low | Low |
| B | Low | Very Rough | Very High | Very High |
| C | Medium | Semi-Soft | Very High | Very High |
| D | High | Soft | Low | Low |
| F | Low | Rough | High | High |
Analysis of moisture content test results
Moisture content is the weight of water contained in an object. And this test was conducted to determine the mass loss of moisture during the heating at different intervals of time, this test detects the shelf life of Bioplastic where, less moisture content means low absorption of water thus, decreasing the growth of fungi and increasing the shelf life of bioplastic. The highest results of moisture content were 7.62% and 3.26% which are for samples A and D respectively, and that indicates that the samples which contain a high amount of potatoes starch have more moisture content since they have the ability to absorb water more than the other samples thus, decreasing their shelf life due to high moisture content increases the growth of fungi. The chart also shows the lowest results of moisture content which were 2.07% and 0.984% for samples F and B respectively and that indicates that the samples which contain a high amount of corn starch have less moisture content since they have a low. Similar studies were reported by Listyarini R, et al. 2020 [8,10-13] (Figure 6)(Table 3).
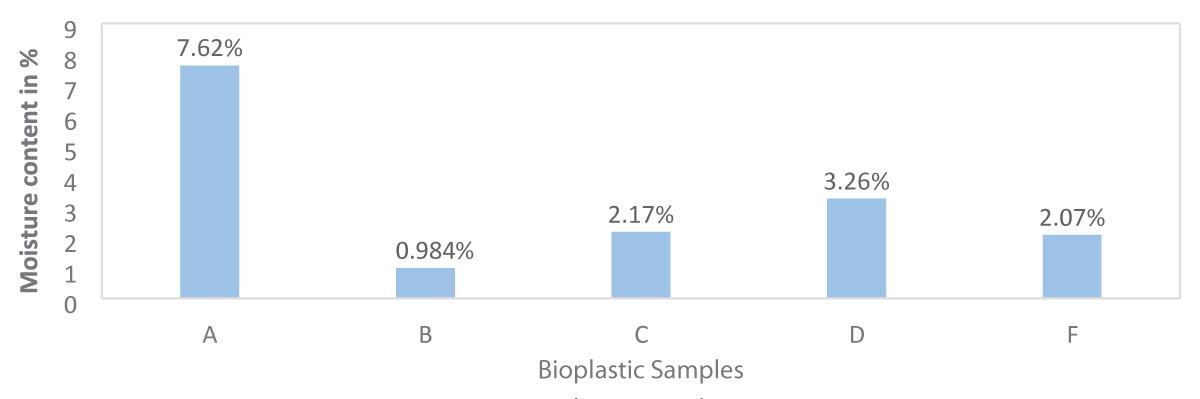
Figure 6: Moisture content
| Table 3: Moisture content results. | |||||||
| Sample | Initial weight with Al foil piece (g) |
After 20 min in (g) |
After 30 min in (g) |
After 40 min in (g) | Net weight of bioplastic sample (without Al foil piece, before heating) (g) |
Net weight of bioplastic sample (without Al foil piece, after heating) (g) |
Moisture content (%) |
| A | 0.311 | 0.311 | 0.3 | 0.3 | 0.1443 | 0.1333 | 7.62 |
| B | 0.37 | 0.368 | 0.368 | 0.368 | 0.2033 | 0.2013 | 0.984 |
| C | 0.351 | 0.351 | 0.347 | 0.347 | 0.1843 | 0.1803 | 2.17 |
| D | 0.32 | 0.315 | 0.315 | 0.315 | 0.1533 | 0.1483 | 3.26 |
| F | 0.36 | 0.356 | 0.356 | 0.356 | 0.1933 | 0.1893 | 2.07 |
Ability to absorb water compared to the other samples which contain a high amount of potato starch thus, increasing their shelf life due to less moisture content and decreasing the growth of fungi. Therefore, using a high amount of potato starch than corn starch is unfavorable, since it increases the moisture content and the ability of bioplastic to absorb water thus, decreasing the shelf life of bioplastic due to its rise growth of fungi. In addition, the high level of moister content limits the bioplastics on short-term applications only, and since it reduces their shelf lives in that regard, using corn starch only as in sample B or less amount of potatoes starch as a combination of two sources for the appearance properties as in samples C or F are more favorable.
The weight of 12 (5 cm × 5 cm) pieces of Al foil was measured to use as a reference (known weight object) while measuring the weight of bioplastic pieces.
12 (5 cm × 5 cm) pieces of Al foil = 2 g
So, for 1 piece = 2 / 12 = 0.1667 g
Analysis of degradation test results
Degradation is the process of degrading and losing the weight of an object over a period of time (Table 4). This includes the degradation ability of bioplastic with respect to the time under conditions such as microorganisms, humidity, sunlight and oxygen. Figure 7 shows the biodegradation percentage (weight loss) of samples, the highest results of biodegradation percentage (weight loss) were 68.27% and 52.6% which are for samples A and D respectively, and the lowest biodegradation percentage (weight loss) was 34.33%, 31.29% which are for sample F and B respectively. The samples which contain a high amount of potato starch have a high biodegradation percentage (weight loss) and the ability to degrade rapidly compared to the other samples which contain a high amount of corn starch due to the highest moisture content of potatoes starch samples. Since the high ability to absorb water fast the degradation property of bioplastic where moisture/humidity is one of the degradation conditions for increase of degradation process. Therefore, using potatoes starch sample A or a high amount of potatoes starch as in sample D will rapid the degradation property of bioplastic since it’s having a high moisture content percentage. Figures 7,8 shows the variation of the biodegradable sample with respect to % biodegradation.
| Table 4: Degradation test results. | ||||||||
| Sample | Initial weight with Al foil piece (g) |
Week 1 in (g) |
Week 2 in (g) |
Week 3 in (g) |
Week 4 in (g) |
Net weight of bioplastic sample (without Al foil piece) Before test (g) |
Net weight of bioplastic sample (without Al foil piece) After test (g) |
Weight loss in (g). |
| A | 0.3 | 0.26 | 0.245 | 0.223 | 0.209 | 0.1333 | 0.0423 | 68.27 |
| B | 0.368 | 0.351 | 0.34 | 0.321 | 0.305 | 0.2013 | 0.1383 | 31.29 |
| C | 0.347 | 0.342 | 0.31 | 0.278 | 0.275 | 0.1803 | 0.1083 | 39.93 |
| D | 0.315 | 0.3 | 0.271 | 0.254 | 0.237 | 0.1483 | 0.0703 | 52.6 |
| F | 0.356 | 0.341 | 0.333 | 0.302 | 0.291 | 0.1893 | 0.1243 | 34.33 |
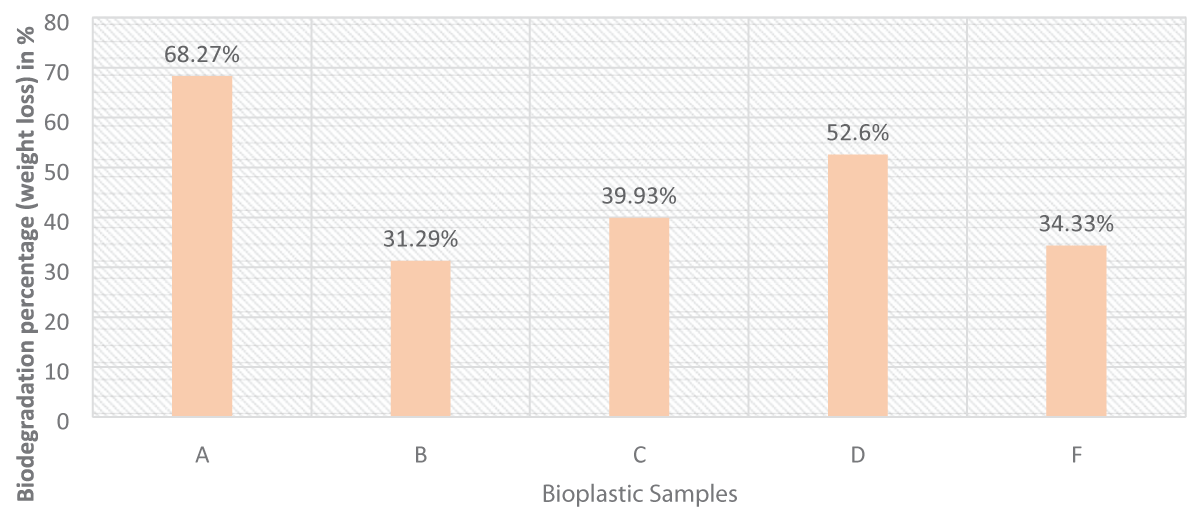
Figure 7: Moisture content.
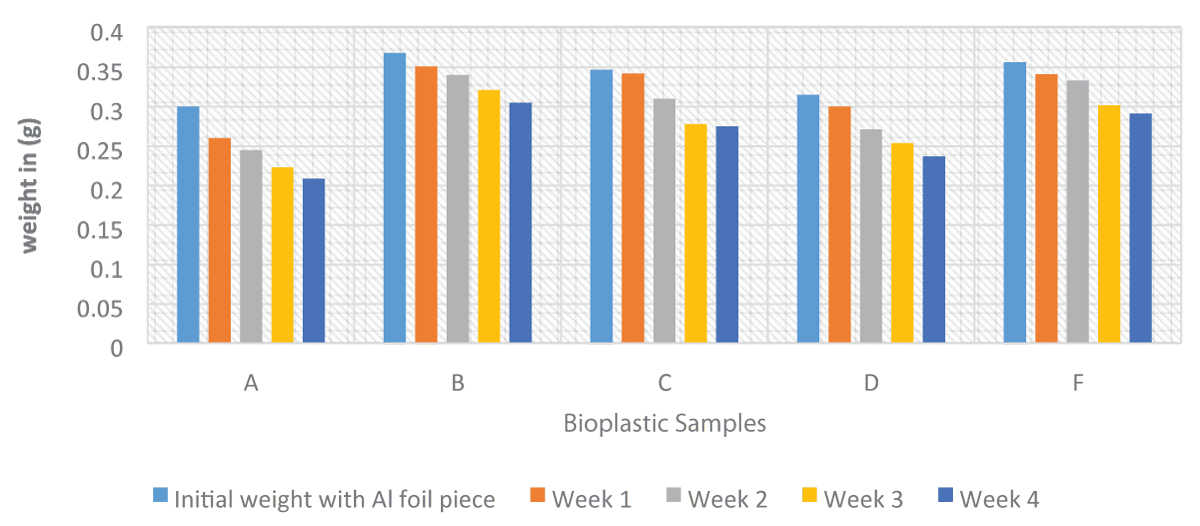
Figure 8: Degradation Test Chart.
The weight of 12 (5 cm × 5 cm) pieces of Al foil was measured to use it as a reference (known weight object) while measuring the weight of bioplastic pieces. 12 (5 cm × 5 cm) pieces of Al foil = 2 g So, for 1 piece = 2 / 12 = 0.1667 g, this indicates that the same samples after the first test were used in the second test hence, the initial weight will be the final weight after the 40 min.
Starch-based bioplastics are an excessive substitute for petroleum-based plastics due to their significant properties compared with natural sources. This research focused on five new formulas of bioplastic by combining two sources of starch, extracted from various biomass sources, its properties and comparison between them. The moisture content shows 2.07% and 0.984% for samples F and B respectively, and that indicates that the samples which contain a high amount of corn starch have less moisture content. The highest results of biodegradation percentages were 68.27% and 52.6% which are for samples A and D respectively and the lowest biodegradation percentage were 34.33% and 31.29% which are for samples F and B respectively.
The authors are grateful to the College of Engineering, National University of Science and Technology, Muscat, Oman, for their everlasting support in the research.
- Hasnan L. Plant-Based Plastics Can Make A Difference. 2019. https://theaseanpost.com/article/plant-basedplastics-can-make-difference
- Chander M. Microbial Production of Biodegradable Plastics from Agricultural Waste. International Journal of Research and Analytical Reviews (IJRAR). 2019; 6(2):552-553.
- Mathiot C, Ponge P, Gallard B, Sassi JF, Delrue F, Le Moigne N. Microalgae starch-based bioplastics: Screening of ten strains and plasticization of unfractionated microalgae by extrusion. Carbohydr Polym. 2019 Mar 15;208:142-151. doi: 10.1016/j.carbpol.2018.12.057. Epub 2018 Dec 18. PMID: 30658785.
- Arikan E, Bilgen H. Production of Bioplastic from Potato Peel Waste and Investigation of Its Biodegradability. International Advanced Researches and Engineering Journal. 2019;3(2):93-97.
- Pathak S, Sneha C, Mathew B. Bioplastics: Its Timeline Based Scenario & Challenges. Journal of Polymer and Biopolymer Physics Chemistry. 2014;2(4):84-90.
- Khanna S. Production of Bioplastic from Banana Peels. Journal of Emerging Technologies and Innovative Research (JETIR). 2019; 6(5):218-219.
- Gaonkar M, Palaskar P, Navandar R. Production of Bioplastic From Banana Peels. International Journal of Advances in Science Engineering and Technology. 2017;6(1):36-38.
- Listyarini R, Susilawati P, Nukung E, Yua M. Bioplastic from Pectin of Dragon Fruit (Hylocereus polyrhizus) Peel. Journal Kimia Sains dan Aplikasi. 2020; 23(6):203-208.
- Snijder M. What to Do With All That Marine Plastic Waste (After Having Cleaned Up The Oceans)?, Circular Solutions. 2019.
- Wahyuningtiyas N, Suryanto H. Analysis of Biodegradation of Bioplastics Made of Cassava Starch. Journal of Mechanical Engineering Science and Technology. 2017; 1(1):41-54.
- Yaradoddi J, Patil V, Ganachari S, Banapurmath N, Hunashyal A, Shettar A. Production of Sustainable and Biodegradable Polymers from Agricultural Waste. International Journal of Pharmaceutical Research & Allied Sciences. 2016; 5(4):56-66.
- Kasmuri N, Abu Zait M. Enhancement of Bio-plastic using Eggshells and Chitosan on Potato Starch-Based. International Journal of Engineering & Technology. 2018; 7(3.32):110-115.
- Lubis M, Gana A, Maysarah S, Ginting M, Harahap M. Production of bioplastic from jackfruit seed starch (Artocarpus heterophyllus) reinforced with microcrystalline cellulose from cocoa pod husk (Theobroma cacao L.) using glycerol as plasticizer. IOP Conference Series: Materials Science and Engineering. 2018; 309(1):1-10.